In 2023, As You Sow released Capturing the Diversity Benefit: Workforce Diversity Linked to Financial Performance, which found a statistically significant correlation between higher percentages of BIPOC (Black, Indigenous, and People of Color) management and increases in eight standard financial metrics.
As we worked on Social Justice Funds, our newest Invest Your Values tool, we wondered if we would find a similar effect. How do the returns of mutual funds correlate with their gender equality, diversity disclosures, racial justice, and LGBTQ+ equity ratings?
Correlating fund returns with diversity, equity, and inclusion
Our results showed a statistically significant but weak positive relationship between how a fund was scored on Social Justice Funds and financial performance. The relationship is not strong enough to say Social Justice Funds scores predict returns, but it doesn’t appear to penalize performance either.
Social Justice Funds scores correlated with month-end trailing returns, as of Oct 2025
| Period | # of Funds | r | R2 | p-value | ρ | Strength | Direction |
|---|---|---|---|---|---|---|---|
| 1-Year | 3,183 | +0.0855 | 0.00732 | 1.35E-06 | +0.217 | Very weak | Positive |
| 3-Year | 2,899 | +0.224 | 0.0501 | 3.21E-34 | +0.308 | Weak–Moderate | Positive |
| 5-Year | 2,645 | -0.0958 | 0.00917 | 8.02E-07 | +0.0572 | Very weak | Mixed |
| 10-Year | 2,106 | +0.228 | 0.0519 | 3.41E-26 | +0.298 | Weak–Moderate | Positive |
Calculating correlation provides a straightforward statistical measure of how closely two variables move together: whether higher Social Justice Funds scores tend to coincide with higher or lower returns. By examining multiple time horizons, we can see whether any relationships are persistent over the long run.
The results were stronger when just the U.S. Large Cap Equity, U.S. Small/Mid Cap Equity, and Allocation fund groups were considered. For these U.S.-focused funds, higher Social Justice Funds scores were modestly but reliably associated with stronger financial performance, especially over longer time horizons.
U.S. Large Cap Equity, U.S. Small/Mid Cap Equity, and Allocation funds: Social Justice Funds scores correlated with month-end trailing returns, as of Oct 2025
| Period | # of Funds | r | R2 | p-value | ρ | Strength | Direction |
|---|---|---|---|---|---|---|---|
| 1-Year | 2,415 | +0.174 | 0.0303 | 7.10E-18 | 0.324 | Weak | Positive |
| 3-Year | 2,195 | +0.309 | 0.0957 | 6.47E-50 | 0.381 | Weak–Moderate | Positive |
| 5-Year | 2,012 | +0.139 | 0.0193 | 3.99E-10 | 0.175 | Weak | Positive |
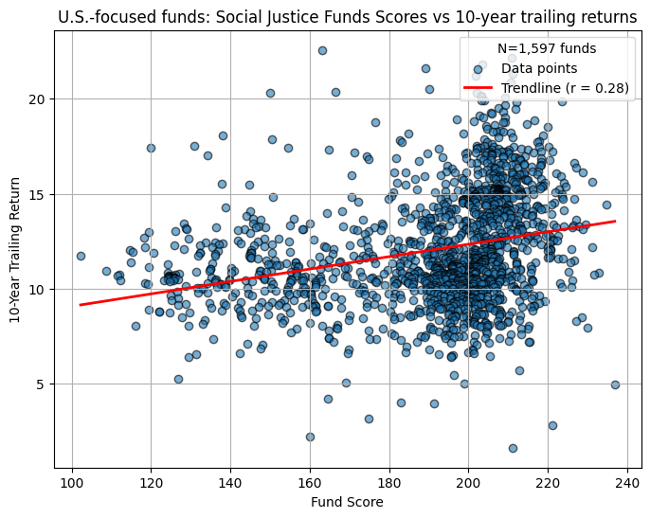
| 10-Year | 1,597 | +0.279 | 0.0777 | 6.87E-30 | 0.359 | Weak–Moderate | Positive |
The scatterplot below shows the relationship between Social Justice Funds scores and 10-year trailing returns for U.S.-focused funds.
Looking at these U.S.-focused funds, the Racial Justice and Diversity Disclosures scores had the strongest correlation with long-term 10-year performance.
U.S. Large Cap Equity, U.S. Small/Mid Cap Equity, and Allocation funds: Gender equality, diversity disclosures, racial justice, and LGBTQ+ scores from Social Justice Funds correlated with month-end trailing returns, as of Oct 2025
| Score | Period | # of Funds | r | R2 | p-value | ρ | Strength | Direction |
|---|---|---|---|---|---|---|---|---|
| Gender Equality | 10-Year | 1,597 | +0.0812 | 0.0066 | 1.16E-03 | 0.0703 | Very weak | Positive |
| Diversity Disclosures | 10-Year | 1,597 | +0.326 | 0.106 | 7.43E-41 | 0.411 | Weak–Moderate | Positive |
| Racial Justice | 10-Year | 1,597 | +0.331 | 0.109 | 4.71E-42 | 0.413 | Weak–Moderate | Positive |
| LGBTQ+ Equity | 10-Year | 1,597 | +0.243 | 0.0588 | 8.26E-23 | 0.267 | Weak–Moderate | Positive |
What it means
These results are in alignment with previous As You Sow research in The Diversity Benefit report. In short: Beware those who say DEI is a “non-financial” factor that should be ignored in investing, or that integrating DEI as an investment factor means sacrificing returns. The evidence doesn’t agree – it shows that individuals and workplaces can shift their financial systems away from harm and toward justice, equity, and long-term impact while generating strong returns.
Methodology
Social Justice Funds scores mutual fund portfolios on four key metrics: gender equality, diversity disclosures, racial justice, and LGBTQ+ equity. Each of these fund scores are calculated by applying a different company scorecard to the portfolio holdings and aggregating a market value-weighted portfolio score. For the purposes of this analysis, these four scores were combined into a single Social Justice Funds score by summing.
Relationships between Social Justice Funds scores and financial performance were assessed using ordinary least squares (OLS) linear regression. OLS regression is a statistical analysis used to assess the relationship between two variables. OLS regression can provide information on both the direction (positive or negative) and strength of the relationship. The results of this method can be assessed for statistical significance using p-values. The p-value is used to verify hypotheses, where a smaller p-value indicates a lower likelihood of a value occurring by chance. Traditionally, p < 0.05 indicates a value is unlikely to occur by chance and is therefore statistically significant, which is what the following analyses use.
Some limitations should be noted. Since the fund scores reflect current holdings and current company scores, they may not accurately represent a fund’s composition over the past 1–10 years, or how companies performed on justice-focused KPIs over time. Coverage limitations in the four company scorecards, particularly for small-cap or non-U.S. holdings, may introduce bias in the fund universe.
All funds included in this analysis are U.S. domiciled open-end mutual funds or ETFs, with a handful of collective trusts and variable annuities. Only funds with at least 50% of the portfolio invested in stocks were included. Funds were grouped into 5 categories: U.S. Large Cap Equity, U.S. Small/Mid Cap Equity, International Equity, Sector Equity, and Allocation. Only funds that are rated on all four equity and justice issues, meaning at least 33% of the portfolio had coverage on all four company scorecards, were included. The fund holdings data is as of October 2025. The fund performance data is as of the last day of September 2025.